Results
Below are a few pictures showing the results being presented.
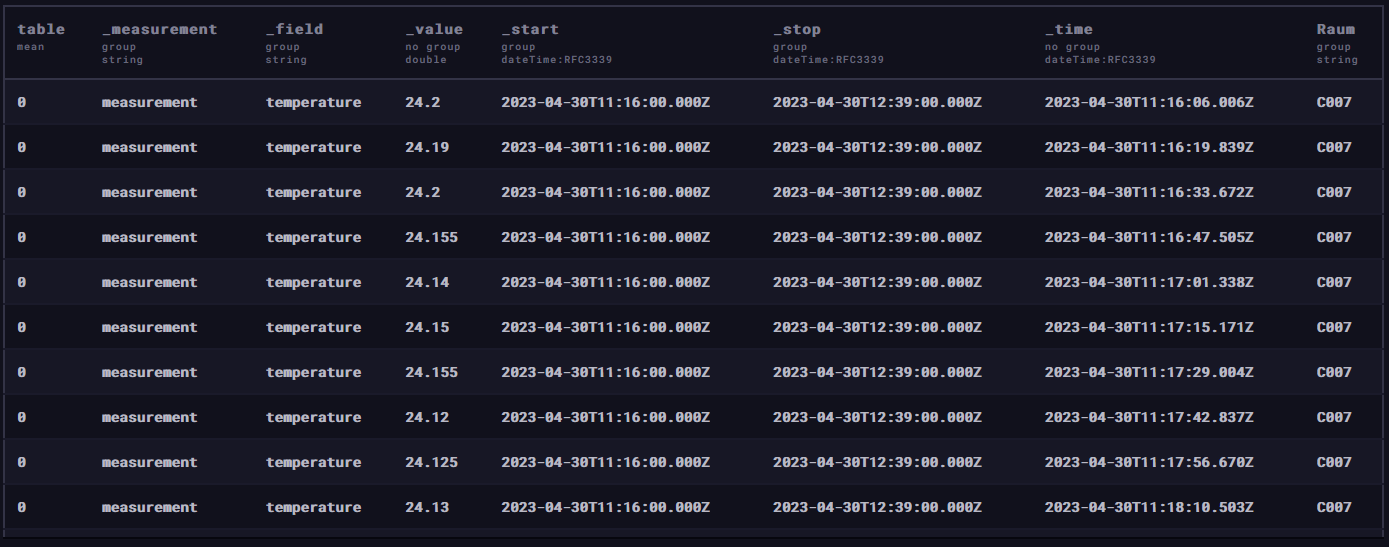
Figure: Uploaded temperature values to the database, from Kai W.
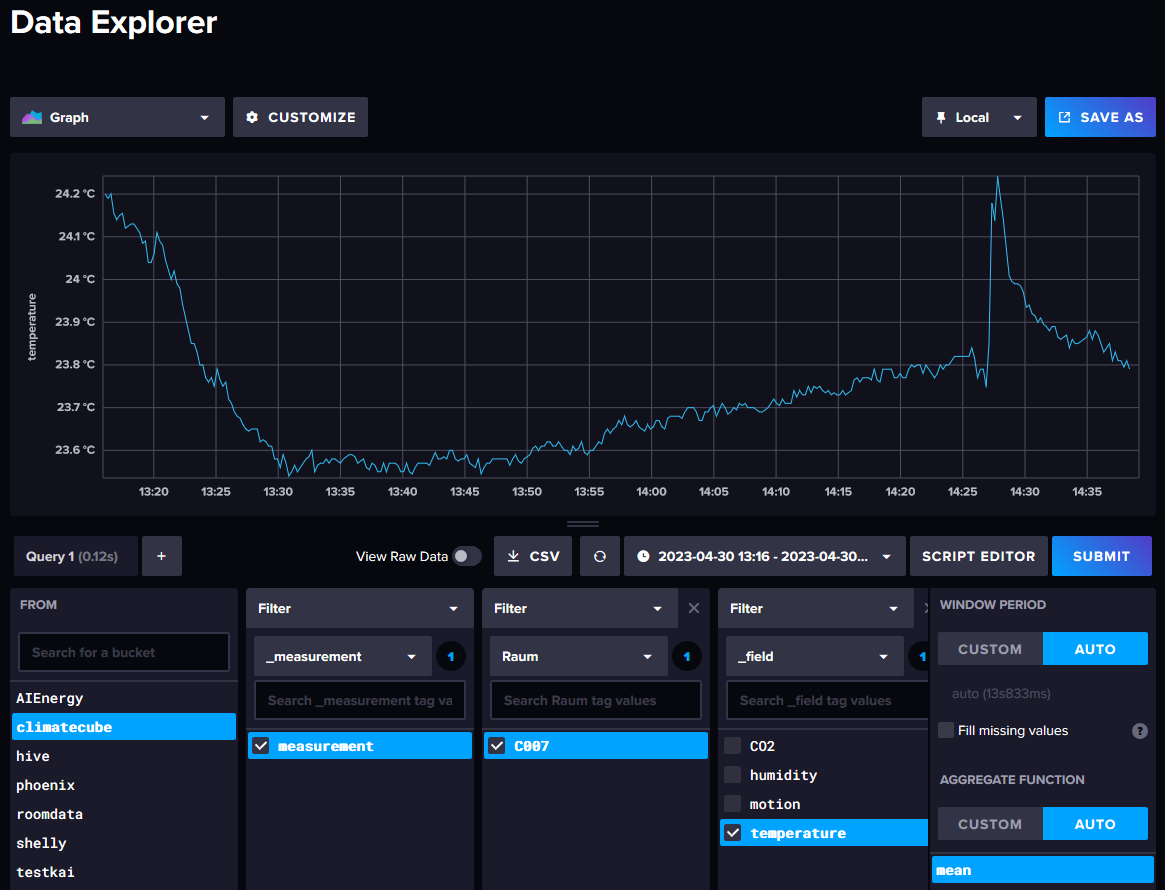
Figure: Graphical representation of the measured temperature, from Kai W.
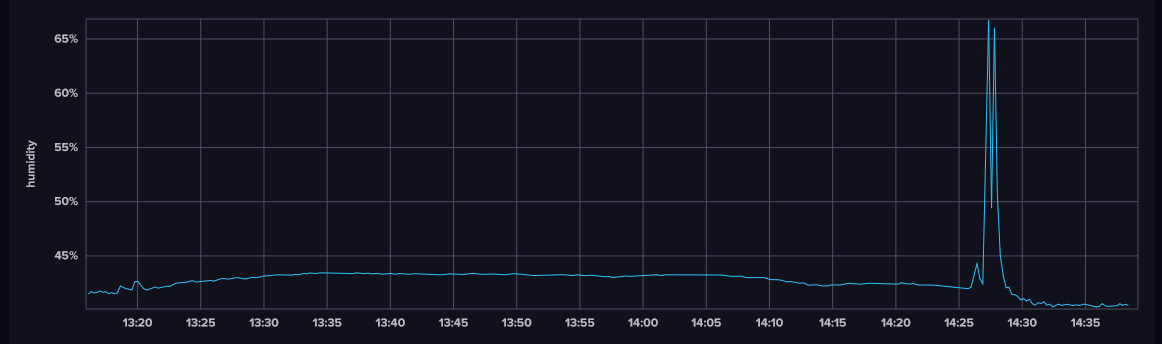
Figure: Graphical representation of the measured humidity, from Kai W.
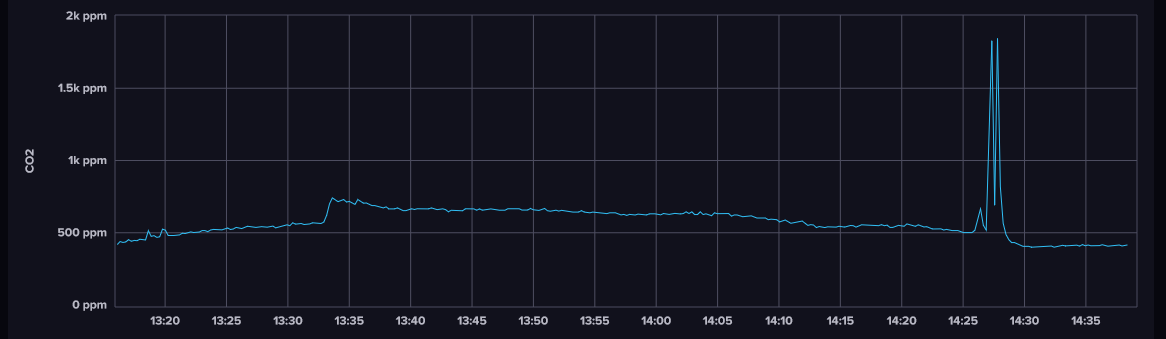
Figure: Graphical representation of the measured co2 values, from Kai W.
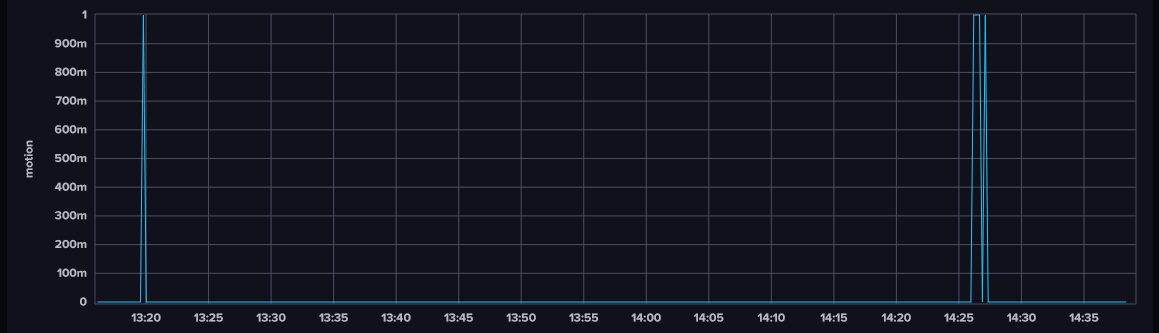
Figure: Graphical representation of the detected presence, from Kai W.
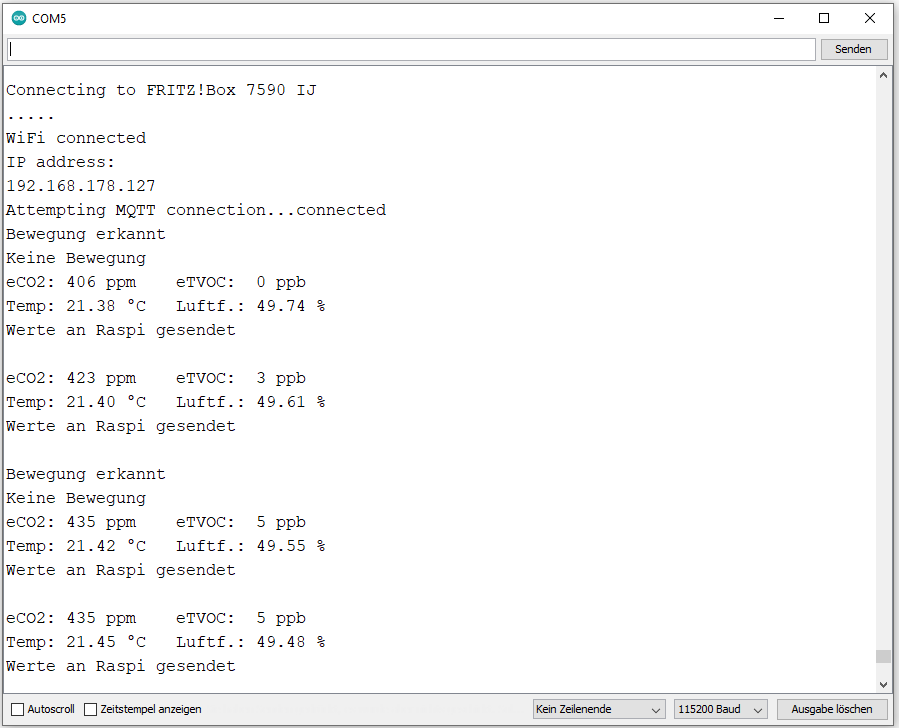
Figure: Output on the ESP32's serial monitor, from Kai W.
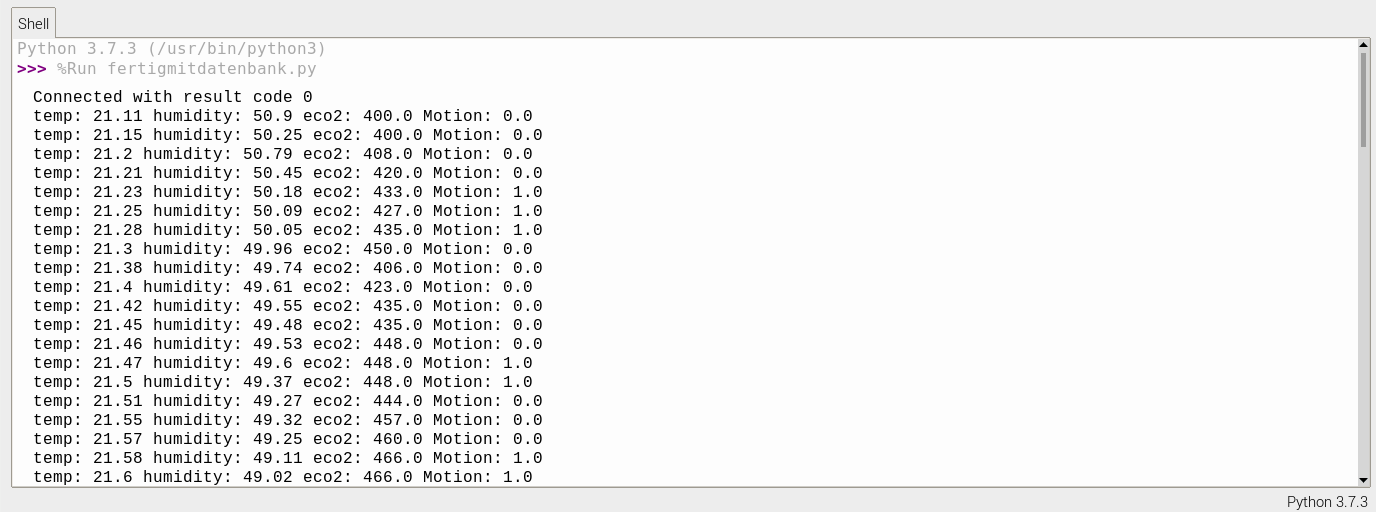
Figure: Output on the Raspberry Pi's serial monitor, from Kai W.
Zuletzt geändert: Montag, 3. Juli 2023, 12:29